High magnetic fields let you see things at the molecular and atomic level that you couldn't otherwise see. As a bonus, those things sometimes generate not just great data, but great dada — or cubism, pointillism or other style. We decided the year 2020 was the perfect time to celebrate this powerful and beautiful magnetic vision.
Here are some examples of charts, diagrams, scans and other visualizations of research conducted at national magnet labs. We stripped the notations and, with a few swipes of our Photoshop eraser, turned science into art. Gaze upon them as you might paintings in a gallery, and enjoy the feelings, questions and associations they conjure for you. Then, to find out about the cool science, click on the buttons below each image.

Reveal the Science
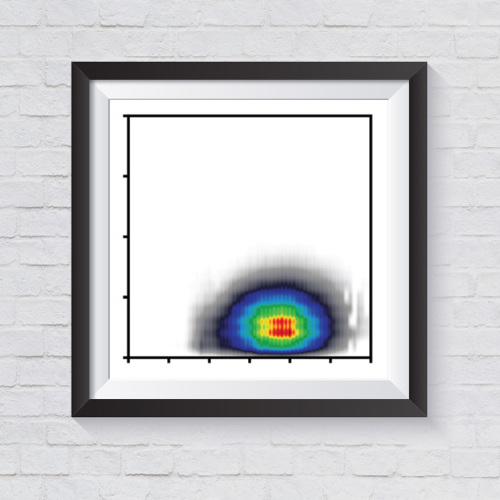
Energy Gaps in Two-Dimensional Superlattice
Image Credit: Sergio Pezzini, Center for Nanotechnology Innovation, Istituto Italiano di Tecnologia, and Uli Zeitler, High Field Magnetic Laboratory, Radboud University
This color plot shows the behavior of particles called replica Dirac fermions in a special material made of one two-dimensional material (graphene, an allotrope of carbon) stacked atop another (hexagonal boron nitride). The particles form special states, called field-induced insulating states, under certain experimental conditions of high magnetic field and low temperature. The bright areas show the specific conditions under which these states occurred.
Links:
Reveal the Science
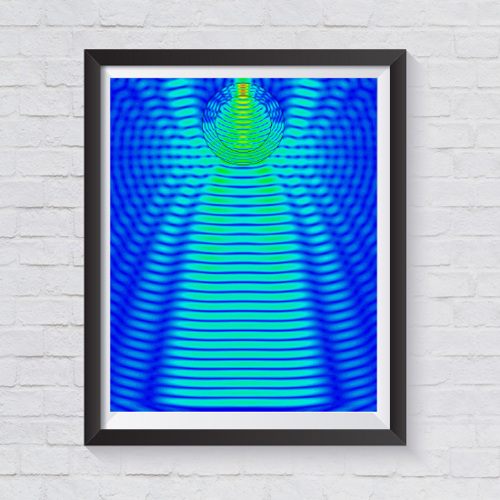
Microwaves
Image Credit: Faith Scott, National MagLab
This image, generated by a software program for the purposes of developing a special instrument at the National High Magnetic Field Laboratory, represents how microwaves would travel through a sample placed inside a nuclear magnetic resonance magnet. Red represents high microwave intensity, blue represents low intensity and yellow is in between. The scientists developing this instrument, a probe to hold the sample during a type of experiment called magic angle spinning dynamic nuclear polarization (MAS-DNP), need to know how the microwaves used in the experiment will interact with the samples. The goal is to achieve high microwave intensity throughout the sample area (shown in black circles in the image). The new probe will help scientists investigate biological samples as well as materials.
Links:
Reveal the Science
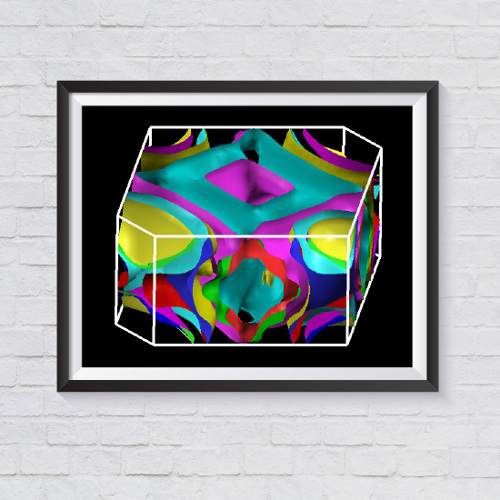
Fermi Surface
Image Credit: Dana Browne, Louisiana State University
Materials called superconductors are quite special because they conduct electricity with no resistance, usually only under certain extreme conditions such as super cold temperatures. Bismuth paladium (BiPd) is one example of a superconductor, and physicists suspect it may also be a topological material, a fascinating class of materials, not yet fully understood, that boast unique electronic properties and behaviors that could make them useful in future technologies. If true, BiPd would be one of just a few known topological superconductors. Scientists studied this material in high fields at the National MagLab to measure its Fermi surface, which is an abstract geometrical representation of those electrons in the material available to perform interesting behaviors, including topological states. Their measurements yielded new evidence that BiPd is, in fact, a topological material. This image represents the complex Fermi surface that had been calculated for BiPd, which agreed with the experimental results. This confirmation provides the scientists greater confidence in the predictive capabilities of the model.
Links:
Reveal the Science
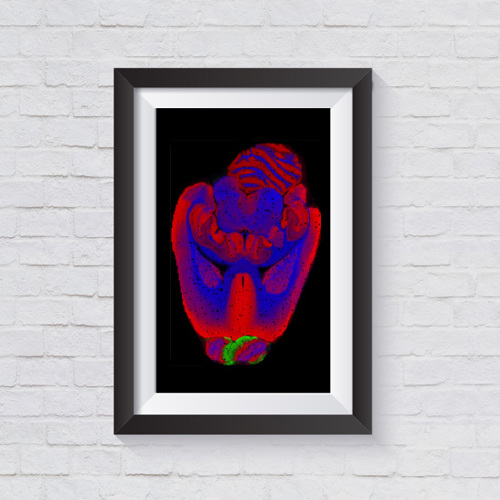
Rat Brain
Image Credit: Don Smith, National MagLab
This image of a rat brain reveals the distribution of three specific lipids and was made using a special technique called mass spectrometry imaging (MSI). It was generated using a 21-tesla ion cyclotron resonance mass spectrometer at the National MagLab. To understand the orientation of this image, imagine that you are standing above a rat and looking down at the top of its head. The part with some green is the olfactory bulb, located near the nose at the front of the brain and used for smelling. The part with the folds is the cerebellum, at the back of the brain.
Links:
Reveal the Science
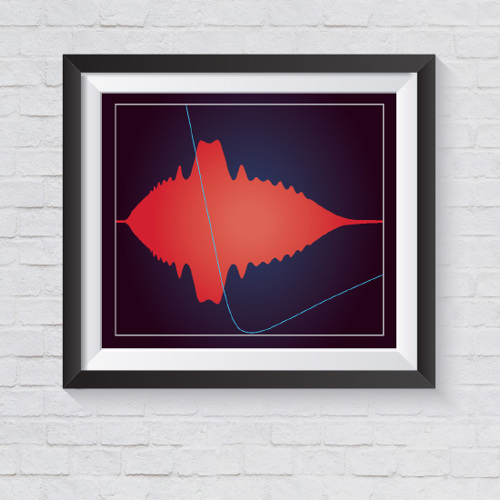
Quantum Oscillations
Image Credit: Brad Ramshaw, Cornell University
This image resulted from an experiment performed in 2013 at the Pulsed Field Facility of the National MagLab. Brad Ramshaw, a postdoc working at the lab at the time, had built a special probe, a stick-like device used to place a sample inside a magnet and take measurements. The probe was designed in part to exclude extraneous information, or “noise,” from the data. When he used it for the first time in a high-field pulsed magnet, it excluded noise so well that he could see the signal he was searching for directly in the raw data. This signal (shown in red) is called quantum oscillations, and its wavelike undulations contain important information for physicists, in this case information about the electrons in a high-temperature superconductor called yttrium barium copper oxide (YBCO). The experiment ultimately led to a paper in the prestigious journal Science.
Links:
Reveal the Science
Crude Oil
Image Credit: Ryan Rodgers, National MagLab
Some crude oils contain acids, called naphthenic acids (or NAPs). These highly complex molecules can react with the iron in refinery pipelines, forming compounds, called iron naphthenate, that ultimately corrode those pipelines.
It turns out, however, that corrosion rates do not correlate well with the concentration of NAPs present in crude oil. This suggests that only a fraction of the NAPs present are reactive. It would be useful to know which of these compounds cause the damage, which is what this image tells us.
Iron naphthenate decomposes at the high temperatures used in the refining process, yielding a type of compound called a ketone. When scientists examine the exact molecular composition of a ketone, they can deduce which specific NAPs initially reacted with iron to form the iron naphthenate.
Scientists working at the National MagLab used a tool called ultra-high resolution mass spectrometry to analyze both the original, unreacted NAPs and the ketones that they contribute to forming during the refining process. This figure from that study is the first mass spectral analysis of both these compounds.
The image on the left shows the molecular analysis of the original NAP (specifically, it shows the molecule’s carbon number and its double bond equivalents (or DBE — the number of rings and double bonds to carbon). The image on the top right shows the predicted molecular analysis of the resulting ketone from that NAP, which assumes that each acid would be equally likely to react with the iron. However, the actual molecular analysis of the resulting ketone corrosion products (bottom right) is quite different, which suggests that NAPs with lower DBE are more reactive with iron.
Links:
Reveal the Science
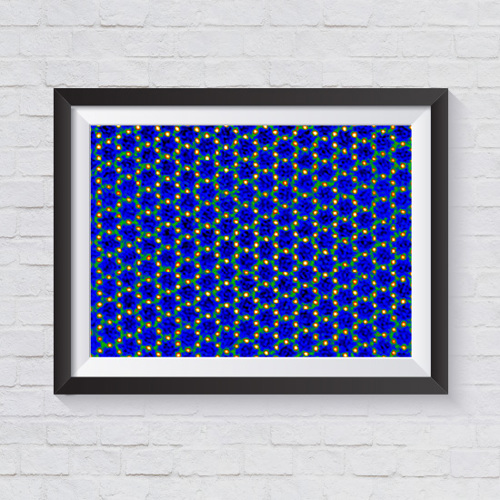
Kagome Pattern
Image Credit: Alyssa Henderson and Yan Xin, National MagLab
This is the first example of a kagome lattice imaged from a bulk (or three-dimensional) material. A kagome lattice is an arrangement of atoms in a pattern resembling a Japanese style of basket weaving called kagome. The image, of a crystal grown by MagLab graduate research assistant Alyssa Henderson, was taken at the MagLab by materials scientist Yan Xin using a special scanning transmission electron microscope (STEM). It resulted in Henderson’s first scientific paper on which she was lead author, which described how these atoms move as temperature decreased.
Links:
Story by Kristen Coyne