
Schematic
| Thumbnail View | Image Link | Description |
|---|---|---|
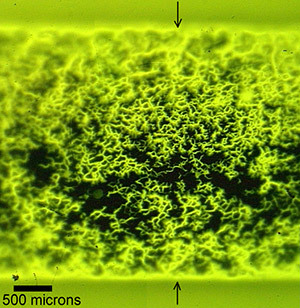 |
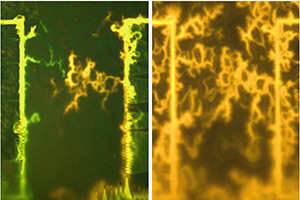
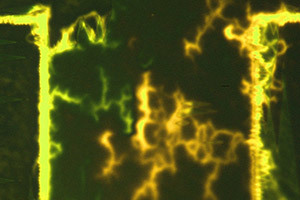
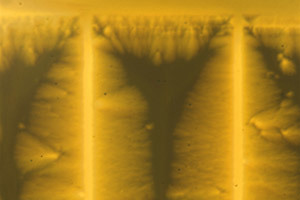
853x887 588KB - JPG | Magneto-optical (MO) image of a 3.3 mm wide YBCO on RABiTS coated conductor. A- Sample was cooled in the absence of a field to 40 K, and then a field of 60 mT was applied. |
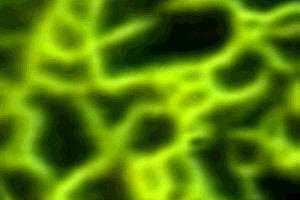 |
300x297 71KB - JPG | Magneto-optical (MO) image of a 3.3 mm wide YBCO on RABiTS coated conductor. B- A close up of the granular nature of the magnetic field. The field penetrates preferentially along grain boundaries in the YBCO. These grain boundaries are replicated from the RABiTS substrate. |
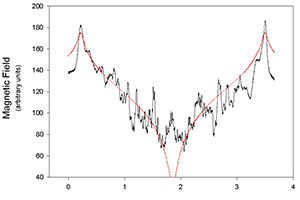 |
922x647 99KB - JPG | Magneto-optical (MO) image of a 3.3 mm wide YBCO on RABiTS coated conductor. C- A flux profile across the image in A at the location marked by the arrows. In red a profile for a perfectly uniform single crystal has been superimposed. |
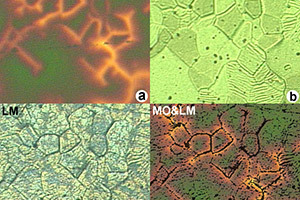 |
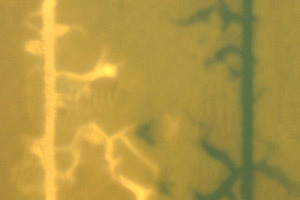
780x761 564KB - JPG | MO and light microscope (LM) images of a deformation textured coated conductor. A- MO image. Sample was cooled in the presence of a 60 mT field to 40 K, and then the field was removed. B- LM image of the surface of the YBCO. C- LM image of the surface of the underlying Ni substrate. YBCO and buffer layers have been removed. D- Superposition of A and C showing that substrate grain boundaries directly effect current flow int he YBCO. |
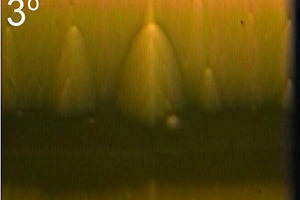 |
478x613 46KB - JPG | MO images of YBCO [001] tilt bicrystals at 3 degrees. The brightness of the grain boundary depends not only on the Jc of the grain boundary, but on the Jc of the intra-grain as well. |
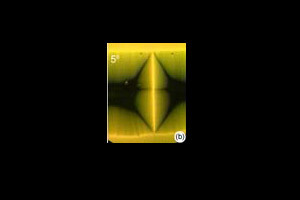 |
79x100 5KB - JPG | MO images of YBCO [001] tilt bicrystals at 5 degrees. The brightness of the grain boundary depends not only on the Jc of the grain boundary, but on the Jc of the intra-grain as well. |
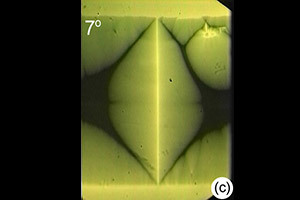 |
477x610 48KB - JPG | MO images of YBCO [001] tilt bicrystals at 7 degrees. The brightness of the grain boundary depends not only on the Jc of the grain boundary, but on the Jc of the intra-grain as well. |
 |
917x801 240KB - JPG | Schematic showing two possible imaging regimes. A,B Zero field coolde (ZFC) regime. The sample is cooled below Tc in the absence of a magnetic field, and then a field is applied. c,d) Field cooled (FC) regime. The sample is cooled below Tc in the presence of a field, and then the field is removed. |
 |
1723x1334 584KB - JPG | MO images of YBCO on RABiTS. A laser scribed link can be seen in the images with dimensions of ~0.5 x 1 mm. a) MO image of the sample under an applied transport current of 1.0 A, equal to Ic. Notice only portion of the GBs are visible in the link;, highlighting the location of dissipation. b) A zero field cooled (ZFC) image of the link, showing more of the GBs in the link. |
 |
390x713 39KB - JPG | MO image of YBCO on a deformation textured substrate. A laser scribed link can be seen in the images with dimensions of ~0.4 x 1.1 mm. This image is an image of the self field of the link at an applied current of 2.4 A, equal to Ic. |
 |
851x1293 393KB - JPG | MO images of the self field of YBCO on RABiTS. A laser scribed link can be seen in the images with dimensions of ~0.5 x 1 mm. A- MO image of the link at I = 0.5 Ic, well before the onset of dissipation. |
 |
851x1293 349KB - JPG | MO images of the self field of YBCO on RABiTS. A laser scribed link can be seen in the images with dimensions of ~0.5 x 1 mm. B- I = Ic |
 |
851x1293 336KB - JPG | MO images of the self field of YBCO on RABiTS. A laser scribed link can be seen in the images with dimensions of ~0.5 x 1 mm. C- I = 1.5 Ic, a highly dissipative state. The transition from A to C with increasing applied current is extremely gradual. |
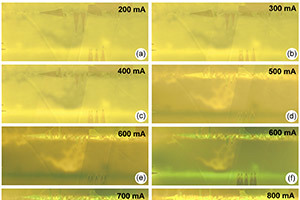 |
2242x1905 1.2MB - JPG | Yet another laser scribed link in a YBCO on RABiTS sample.. The link is ~300 µm wide. Images are shown for an increasing applied currents. Ic = 560 mA. The only difference between E and F is a rotation of the polarizer in the MO microscope, demonstrating that the colors are relative. |
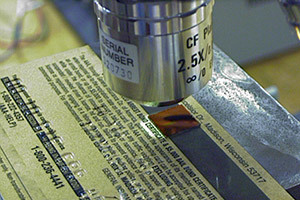 |
640x480 168KB - JPG | MO image of a credit card. A-The indicator film is sitting on top of the magnet strip on the back of a credit card, underneath a microscope objective. |
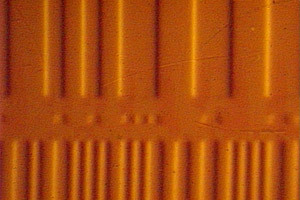 |
640x480 237KB - JPG | MO image of a credit card. B-a MO image of the magnetic pattern on the back of a credit card, taken using the setup in A. |
 |
1080x1520 1MB - JPG | YBCO on single crystal LAO, cut into strips with a laser. |
 |
394x237 8KB - JPG | Schematic of Mo image under an applied magnetic field. A- An applied field induces currents to flow in the sample. |
 |
394x237 9KB - JPG | Schematic of Mo image under an applied magnetic field. B-Sample with indictor film placed on top. The intensity (brightness) of the MO image reflects the magnitude of the local magnetic field. The indicator film produces an intensity map on the Bz component of the magnetic field in a plane just above the surface of the sample. |
 |
375x222 244KB - PNG | Schematic of Mo image under an applied magnetic field. C-a 3D plot of the Bz component of the magneti field imaged in B. |
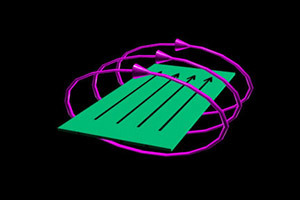 |
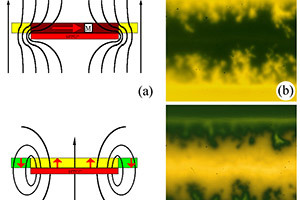
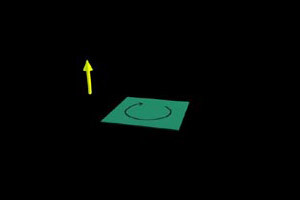
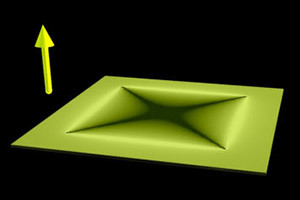
432x298 18KB - JPG | Schematic of MO imaging under an applied transport current. A-a An applied transport current (black arrows) in a superconducting sample (green) produces a magnetic field which wraps around the sample (purple arrows). |
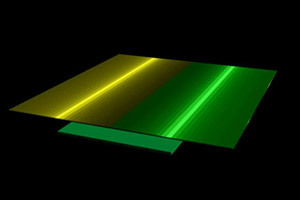 |
432x298 11KB - JPG | Schematic of MO imaging under an applied transport current. B-When the MO indicator film is placed on top of the sample, only the Bz component of the magnetic field is seen. Here the indicator film images the Bz component of the magnetic field in a plane just above the surface of the sample. |
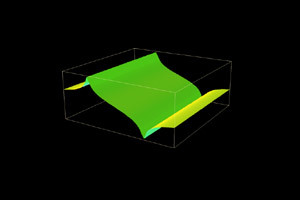 |
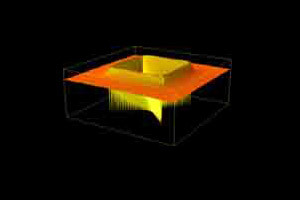
462x272 368KB - PNG | Schematic of MO imaging under an applied transport current. C-a 3D plot of the Bz component of the magnetic field in the plane of the indicator film in b). Not the different colors in the MO image correspond to different direction of magnetic field. |
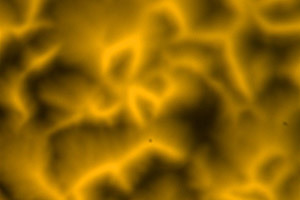 |
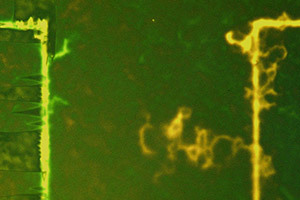
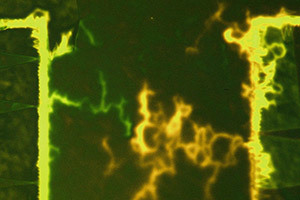
1080x1520 96KB - JPG | MO image of YBCO on a deformation textured substrate. The influence of the granular substrate can clearly be seen. For this image the sample was cooled to 77 K in the absence of a magnetic field, and then a field of 60 mT was applied. |